Office
+44 (0) 1954 231 494
Cambridge Ultrasonics
Cambridge, UK
Consultancy service in physics, electronics, maths & ultrasonics
Cambridge Ultrasonics
Menu of services
- Feasibility testing.
- Ultrasonic design.
- Electronic design.
- Software design.
- Visualization of ultrasound.
- Vector impedance testing.
- Finite element modelling.
- Technical audit for due dilligence.
- Patent searches, avoiding patent infringement and writing preliminary patent specifications.
- Prototype development.
- Market analysis.
Visualization Service - at a glance
- See ultrasound experimentally
- Debug transducers
- Develop new transducers
- Test with signal processing
- Cross reference waves with oscilloscope signals
- Works with almost any transparent material
- Highly cost-effective for debugging
- Many satisfied customers

Ultrasonic waves in water are scattered from a solid metal cylinder viewed along its length (circle in centre). New visualization system, note better image quality than below.
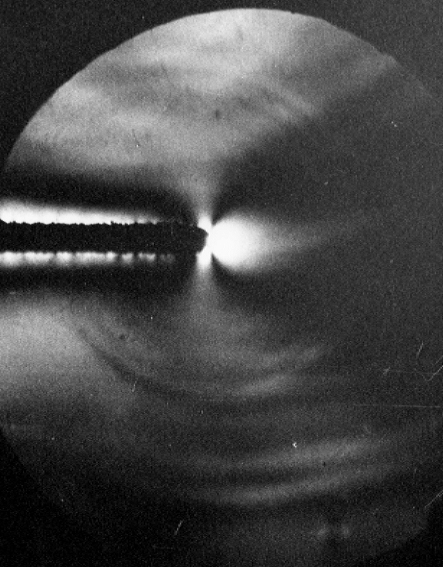
Ultrasonic compression waves in glass are scattered from a slot. Mode conversion occurs at the tip of the slot generating a cylindrical shear wave that travels slower than the compression wave. Older visualization system, note poorer image quality.

Ultrasonic compression waves in glass (bright feature at bottom right) travel down a free surface of the glass (black line on right). Mode conversion creates (supersonic) sources of shear waves on the free surface so shear waves are emitted at an angle to the free surface and at an angle to the compression waves.
Visualization Service
Cambridge Ultrasonics' visualization service is unique in the world.
We strongly recommend it in the development and debugging of ultrasonic transducers - it is the equivalent of an oscilloscope for an electronic engineer. Many clients have used Cambridge Ultrasonics' visualization service over the last 20 years.
Our visualization equipment is in a process of continuous improvement and the present system provides excellent results, having been significantly up-graded in 2008. Another stage of improvement is scheduled for 2011, which should allow the system to work with ultrasonic frequencies of 25 MHz to 50 MHz.
In many applications it is desirable that visualization includes the propagation environment in which the transducer works. For example, a transducer intended to be used in a down-hole oil well inspection tool can be observed with a section of riser pipe to see how the transducer performs an inspection. In this particular case alignment of the tool can be critical.
Visualization is a very powerful way to test a transducer. We have solved many problems for clients in one day that had delayed the clients for many months. The method is highly cost-effective for clients because results are obtained so rapidly.
Pulsed and continuous ultrasound can be observed in transparent materials by using advanced stroboscopic methods coupled with schlieren and photo-elastic optical contrast methods.
Recent improvements now provide both high quality still and super high quality video.
Key features
- Field of view: 300 mm
- Medium: air or water or glass or clear polymers
- Frequency: 30 kHz to 15 MHz
- Spatial resolution: 100 um
- Electronic drive: up to about 300 Vp-p from 50 ohms
The service can either be charged by the day (for transducer evaluation) or on a contractual basis as part of a larger project.